
Technician Performance
Monitor the performance of all your internal techs, by specific work categories and individual techs.
Technician Performance metrics can be filtered by Work Category, or by specific Vendors, using the filter at the top right of the page.
Technician Performance will show you deep analytics into the following:
Engagement
Use the Engagement metrics to track how communication is affecting your overall speed of repair.
- Shortest Response Times
See which technicians respond quickly to Meld chats. - Longest Response Times
See which technicians take too long to respond to Meld chats. - Chat Metrics by Technicians
View all chat-related metrics quickly in a table format. Monitor chat response times, and number of chats/Meld.
Scheduling Efficiency
Keep your Melds moving by tracking which technicians are scheduling quickly and which are throttling your speed of repair.
- Scheduling Lead Time (Days) vs Technician Volume
See how many days a specific technician takes (median) to schedule work. - Assigned to Marked Complete (Days) vs Technician Volume
See which technicians are overloaded. - Median Repair Speeds by Technician
Track all stages of the scheduling process, from vendor acceptance, time to schedule, schedule lead time, and assigned to marked complete. - Scheduling Lead Time (Days) vs Category Volume
See which work categories are taking a long time to schedule and perform work. This is invaluable for forecasting maintenance based on historical data. - Assigned to Marked Complete (Days) vs Category Volume
See which work categories are overloaded. - Median Repair Speeds by Category
View your repair speeds at a glance to see which areas need improvement. - Average Resident Satisfaction Score by Category
See which work categories are creating a negative experience with your residents. This could surface the need for new techs. - Average Resident Satisfaction by Technician
Identify specific technicians that are creating a negative experience with your residents.
Staffing Efficiency
Identify bottlenecks due to staffing, using these metrics.
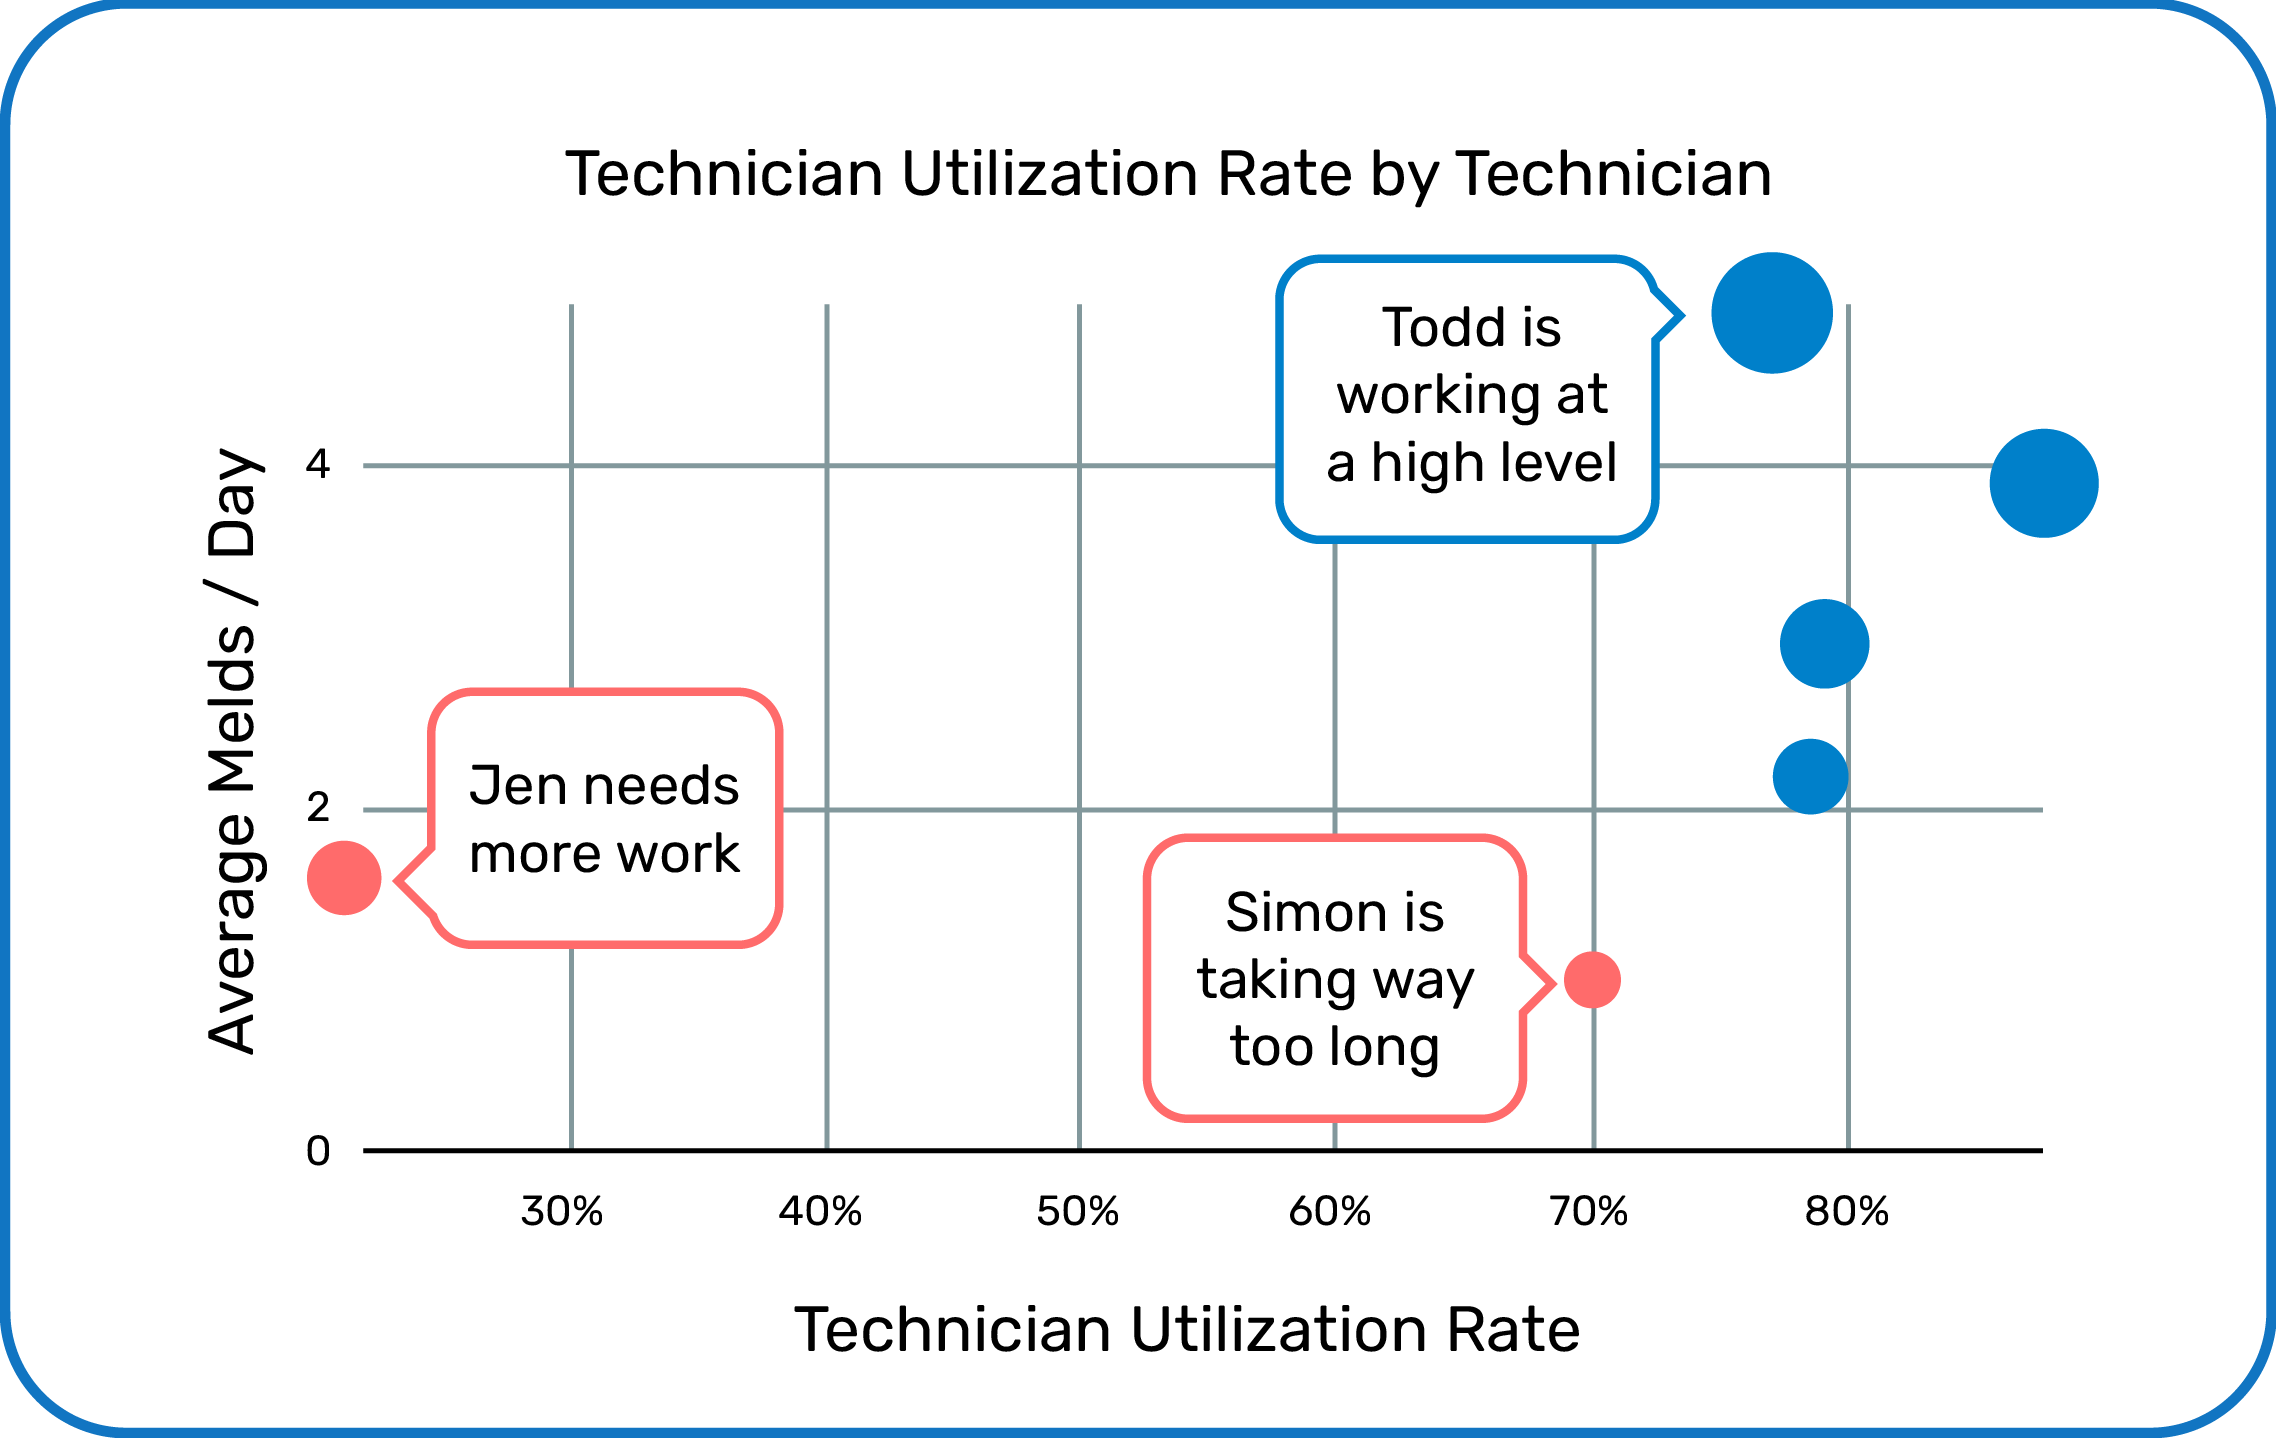
- Technician Utilization Rate by Technician
Tech Utilization Rate is a measurement of the volume and quality of work performed by your technicians, in a given period. It is measured by the total hours logged in Property Meld, by a technician, over their hours per week. - Average Hours Logged per Meld by Category
Track the hours of your techs spent on Melds, by specific work categories. - Efficiency by Technician
Track the efficiency of your technician team at a glance with everyone’s Tech Utilization Rate, hours logged in Property Meld, and number of active Melds. - Efficiency by Category
See which work categories are taking up your techs’ time, and weigh that against the number of Melds per week or month to see if work is being performed as efficiently as needed.
Maintenance Spend
Track your maintenance spend across your team of technicians to see which categories and specific techs are expending the most vs. billable hours spent on jobs.
- Median Expenditure Amount
Track expenditures across your team (median). - Average Expenditure Amount
Track expenditures across your team (average). - Highest Median Expenditure Amounts by Work Category
See which work categories are costing you the most, in terms of expenditures. - Lowest Median Expenditure Amounts by Work Category
See which work categories are the least expensive, in terms of expenditures. - Maintenance Spend by Category
Track how much specific work categories are costing you. - Maintenance Spend by Technician
Track total, median, and average expenditures by each technician, along with total work entry hours. - Maintenance Spend Per Meld with Hours Logged
View the expenditure amount spent on specific Melds, paired with hours spent.
View
Benchmarking