
Benchmarking
Weigh your maintenance process against others in your region, or throughout the entire U.S. and Canada.
Benchmarking will show you deep analytics into the following:
Median Speed of Repair
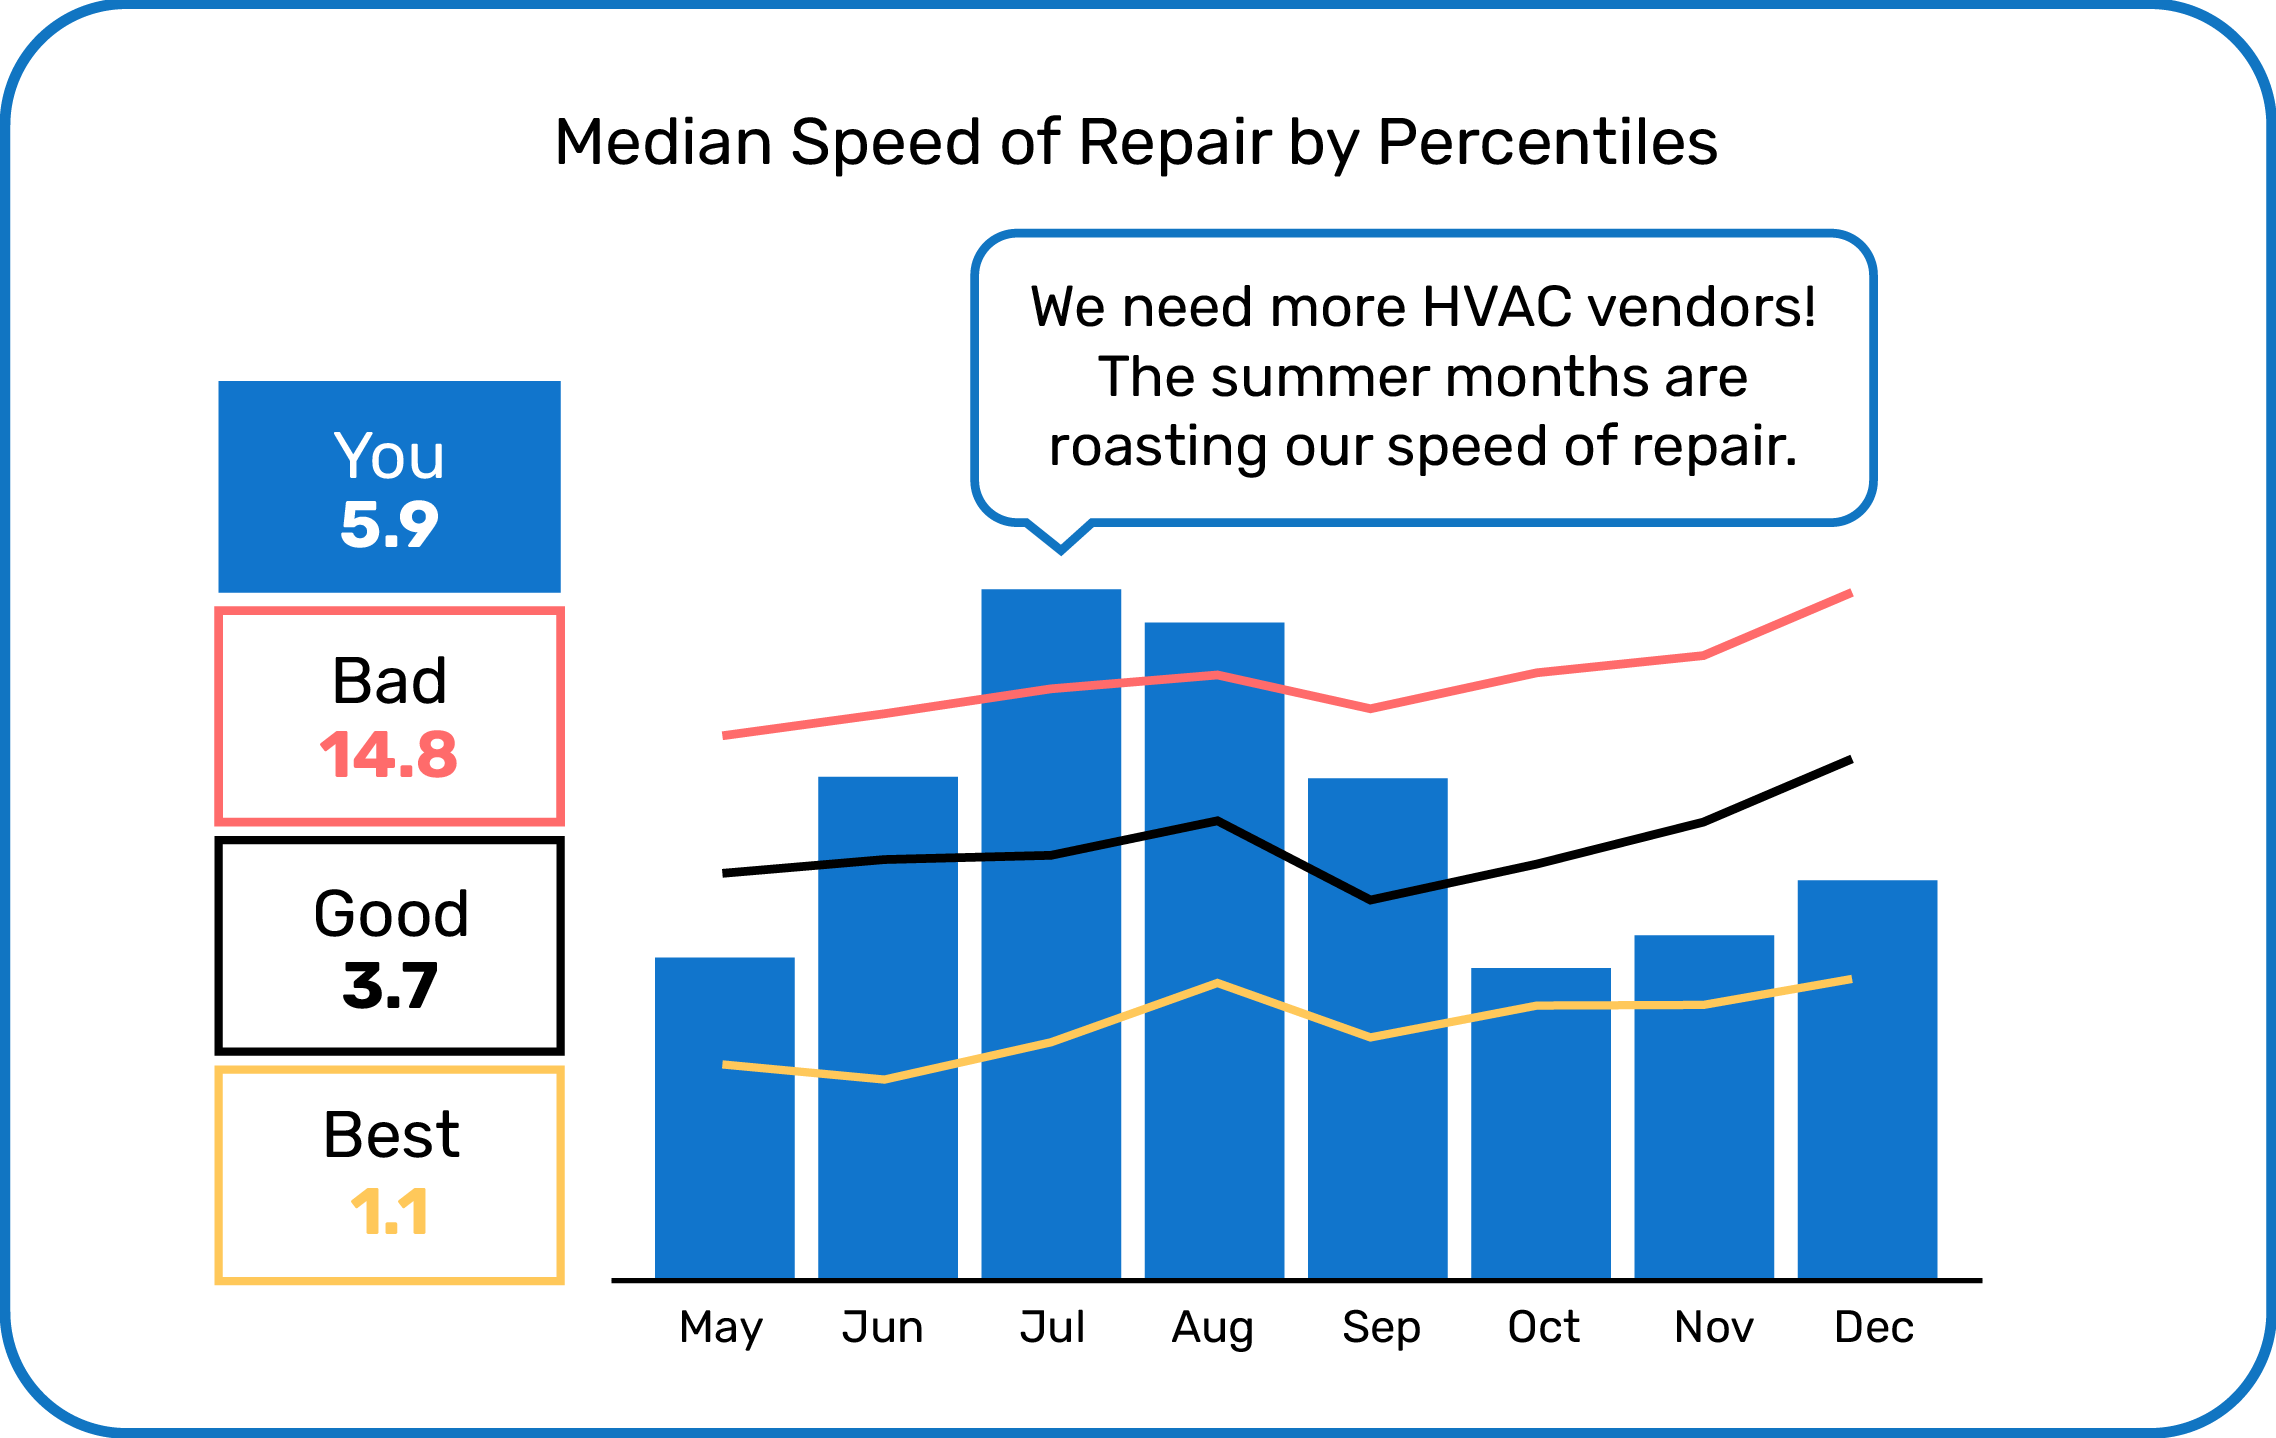
Median Speed of Repair by Percentiles
Measure your speed of repair by percentiles correlating to your filter settings (regional, U.S., Canada). You can also filter by work category to see how certain categories stack up against your competitors.
Median Speed of Repair by Work Category
View how all of your work categories stack up against your competitors, at a glance.
Average Resident Satisfaction Score
Resident Satisfaction is a measurement of your residents’ experience with their maintenance request. It is measured by a numerical rating that residents give after the work is done (1-5 scale). It is calculated by the sum of all resident ratings over the total amount of ratings.
Average Resident Satisfaction Score by Percentiles
Measure your resident satisfaction by percentiles correlating to your filter settings (regional, U.S., Canada). You can also filter by work category to see how certain categories stack up against your competitors.
Average Resident Satisfaction by Work Category
By viewing your average resident satisfaction score across all your work categories, you can quickly see which areas need improvement (highlighted in grey or red).
Maintenance Spend
The maintenance spend metrics within Benchmarks measure both invoice amounts and expenditure amounts. Tracking your maintenance spend in Benchmarks allows you to see if your vendors are competitive against the industry, and it also allows you to show your investors what the going rate for a specific work category is, if the need arises.
Median Vendor Invoice Amount by Percentile
View invoice amounts from vendors within your region, the U.S., or Canada to see if you’re paying more or less than the industry standard. Go a bit further and view by specific work categories to pinpoint where you might be losing too much revenue.
Median Vendor Invoice Amount by Work Category
View your benchmark invoice amounts at a glance, using a table that displays the scores of all individual work categories.
Median Expenditure Amount by Percentile
View expenditure amounts from vendors within your region, the U.S., or Canada to see if you’re paying more or less for parts than the industry standard. Go a bit further and view by specific work categories to pinpoint where you might be losing too much revenue.
Median Expenditure Amount by Work Category
View your benchmark expenditure amounts at a glance, using a table that displays the scores of all individual work categories.